
Two people do the same professional job, hold the same qualifications and sit at neighbouring desks — yet the one whose parents were in working-class occupations is paid thousands of pounds less a year than the one from a professional-managerial home. That disparity is the ‘class pay gap’, and the two organisations that keep it on the public record are the Social Mobility Foundation, whose annual analysis fixes Class Pay Gap Day each November, and the Social Mobility Commission, whose State of the Nation report tracks class mobility across the economy. This page gathers the workplace and pay numbers into one fully cited reference: how large the gap is, where it is widest, how far socio-economic background shapes progression into senior roles, and why — unlike the gender pay gap — no UK employer is yet required to measure it.
Key facts and figures
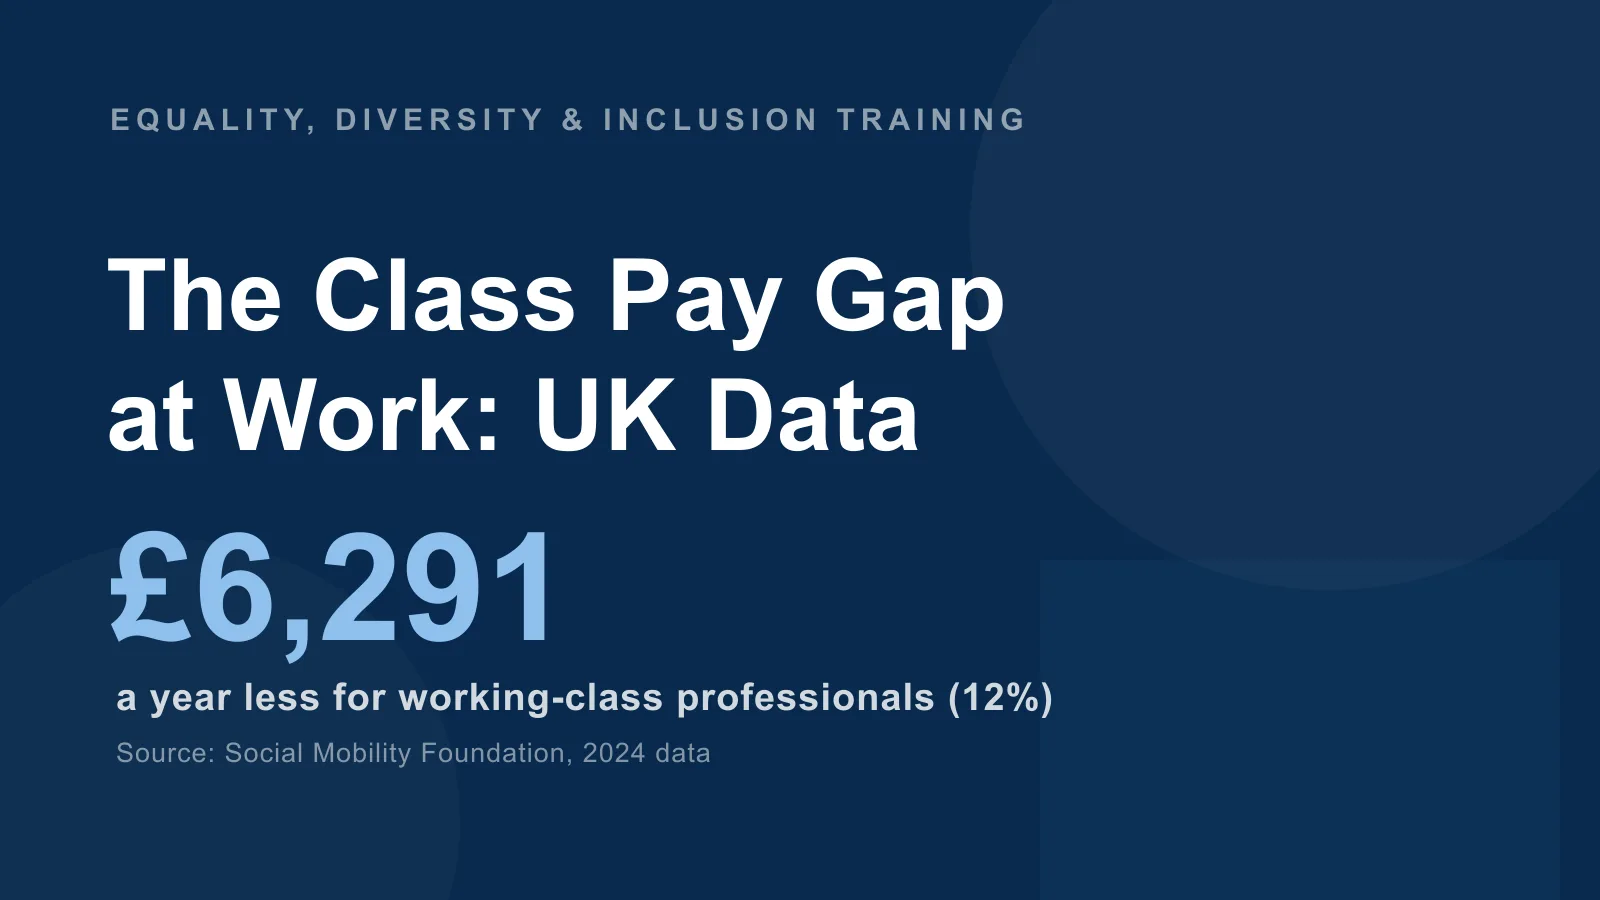
- £6,291 a year less on average for professionals from working-class backgrounds than colleagues from professional-managerial backgrounds in the same occupations — a gap of about 12% (Social Mobility Foundation, 2024 pay data).
- £45,437 average salary for professionals from working-class origins, against £51,728 for those from professional-managerial origins (Social Mobility Foundation, 2024).
- £7,774 the class pay gap in the private sector, which employs around 82% of the UK workforce — wider than in the public sector (Social Mobility Foundation, 2024).
- £6,855 the class pay gap for women, between working-class and professional-managerial origins in the same occupation (Social Mobility Foundation, 2024).
- 17 Nov 2024 Class Pay Gap Day — the date from which working-class professionals effectively work unpaid for the rest of the year, roughly one in eight days for free (Social Mobility Foundation, 2024).
- 75% of young people believe employers should report their class pay gap; 48% say the gap put them off applying to elite professions such as law and finance (Social Mobility Foundation, 2024).
- ~4× young adults from a higher professional-class background are more than four times as likely to be in a higher professional occupation (32%) as those from a lower working-class background (7%) (Social Mobility Commission, State of the Nation 2024, 2022 data).
- 9% of employers focused on improving inclusion for social mobility or socio-economic status in the past five years — the lowest priority of any diversity strand (CIPD).
These are the latest figures available as of July 2026. The two scheduled refreshes to watch are the Social Mobility Foundation’s Class Pay Gap Day each mid-November — which will move the date and republish the gap on fresh pay data — and the Social Mobility Commission’s State of the Nation report each autumn or winter.
What is the class pay gap?
The class pay gap is the difference in pay between people from working-class and professional-managerial backgrounds who are doing the same kind of professional work. It is measured by socio-economic background — usually the occupation of a person’s main household earner when they were aged around 14 — rather than by their current income. Socio-economic background is not one of the nine protected characteristics in the Equality Act 2010, which is why it is often called the informal ‘tenth protected characteristic’: it shapes workplace outcomes as powerfully as the legally protected strands, without the same statutory footing.
It is worth being precise about what this page covers and what it does not. This is the class, or socio-economic-background, pay gap — pay differences that track the home someone grew up in. It is a distinct measure from the ethnicity pay gap, which compares pay between ethnic groups under mandated and voluntary ethnicity reporting, and from the gender pay gap, which the Office for National Statistics measures annually and which sits outside this page. A person can face more than one of these gaps at once, but they are measured separately and driven by different mechanisms.
How much less do working-class professionals earn?
Professionals from working-class backgrounds are paid £6,291 a year less on average than colleagues from professional-managerial backgrounds in the same occupations — a gap of about 12% (Social Mobility Foundation analysis, 2024 pay data, reported via Brightmine). In cash terms, that is an average salary of £45,437 for those from working-class origins against £51,728 for those from professional-managerial origins (2024). The comparison holds occupation constant — these are people in the same kinds of professional job, not a comparison of professionals against manual workers.
The Social Mobility Foundation turns that annual figure into a public marker: Class Pay Gap Day fell on 17 November in 2024, the point in the calendar from which working-class professionals are, in effect, working unpaid relative to their more advantaged peers for the rest of the year — roughly one working day in eight given away for free (2024).
| Cut of the data | Class pay gap (per year) | Source / period |
|---|---|---|
| All professionals (average) | £6,291 (~12%) | Social Mobility Foundation, 2024 |
| Private sector (~82% of workforce) | £7,774 | Social Mobility Foundation, 2024 |
| Women | £6,855 | Social Mobility Foundation, 2024 |
| Professional-managerial origin salary | £51,728 (average) | Social Mobility Foundation, 2024 |
| Working-class origin salary | £45,437 (average) | Social Mobility Foundation, 2024 |
The gap is not evenly spread. In the private sector — which employs around 82% of the UK workforce — it rises to £7,774 a year, wider than in the public sector, where pay scales and transparent grades leave less room for background to influence salaries (2024). And it compounds with gender: the class pay gap for women is £6,855 a year between working-class and professional-managerial origins in the same occupation (2024), meaning a woman from a working-class background sits at the intersection of two distinct pay penalties.
What is the ‘class ceiling’ and how big is it?
The term ‘class ceiling’ describes the way people from working-class backgrounds are held back from the top of high-status professions even after they enter them. The foundational academic work is Sam Friedman and Daniel Laurison’s The Class Ceiling: Why It Pays to Be Privileged (2019), which found that in elite occupations people from working-class origins earn around 16% less than colleagues from privileged backgrounds — a gap that persists even after controlling for the same degree, university and job. In other words, matching qualifications and role does not close the gap, which points to factors beyond credentials: networks, workplace culture, confidence norms and sponsorship.
Government-commissioned research reached a similar conclusion earlier. The 2017 study of Britain’s professions, published on GOV.UK and drawn from more than 90,000 Labour Force Survey respondents, found that people from working-class backgrounds in professional jobs earned £6,800 (about 17%) less a year than colleagues from more affluent backgrounds, even with the same qualifications (2017 data). That two independent analyses — one academic, one government — land on a mid-to-high-teens percentage penalty is the strongest evidence that the class pay gap is real and not an artefact of one dataset.
How does socio-economic background affect progression to senior roles?
The higher up an organisation you look, the more it is dominated by people from professional-managerial backgrounds. The Bridge Group’s 2025 research found that 89% of senior leaders are from higher socio-economic backgrounds, against 47% at junior levels — and that women from working-class backgrounds progress around 21% more slowly into senior roles than their peers (2025). Progression, not just entry pay, is where the class ceiling does its work.
Financial services, one of the few sectors measuring itself in depth, shows the same shape with signs of slow movement. Progress Together’s Shaping the Sector analysis of around 200,000 employees found that the share of senior leaders from a lower socio-economic background rose from 26% in 2023 to 28% in 2024, while 58% of senior leaders were from a higher socio-economic background against 45% at junior level (2024). The near-doubling of higher-background representation between the bottom and the top of the same industry is the class ceiling made visible in a single dataset.
Some professions are strikingly narrow at the point of entry. According to the CIPD, nearly two-thirds of journalists and around eight in ten vets are from a higher socio-economic background — a composition that shapes who gets to tell stories and set professional norms long before pay enters the picture.
How does this fit the wider social mobility picture?
Britain’s pay gaps at work sit on top of much larger differences in who reaches professional jobs at all. The Social Mobility Commission’s State of the Nation 2024 report found that young adults from a higher professional-class background are more than four times as likely to be in a higher professional occupation themselves (32%) as those from a lower working-class background (7%) (2022 data). That occupational-destination gap is the backdrop against which the pay gap operates: fewer working-class people reach professional roles, and those who do are then paid less within them.
This page deliberately keeps school attainment, child poverty and regional mobility to this single paragraph — those are the territory of the Social Mobility Commission’s flagship analysis and education charities, not the workplace-pay lens covered here. One economic figure is worth carrying across, though, because it reframes the issue as growth rather than only fairness: analysis by Demos, reported through State of the Nation coverage, estimated that if all businesses invested significantly in social mobility it would add around £19 billion to UK GDP a year (2024).
Do UK employers have to report their class pay gap?
No. Unlike the gender pay gap, there is no legal requirement for any UK employer to measure or publish its class pay gap. Gender pay gap reporting has been mandatory for employers with 250 or more staff since 2017; socio-economic background has no equivalent duty, which is the central policy hook in this field and the reason campaigners push for a ‘socio-economic duty’. Section 1 of the Equality Act 2010 — a socio-economic duty on public bodies — was passed but has never been commenced in England, leaving measurement entirely voluntary.
Voluntary uptake is growing but remains small. In the Social Mobility Foundation’s Employer Index, 26 organisations measured their class pay gaps in 2024, rising to 36 in 2025 — real momentum, but a tiny fraction of UK employers. Public appetite runs well ahead of practice: 75% of young people believe employers should report their class pay gap, and 48% say the gap put them off applying to elite professions such as law and finance (2024), a direct talent-pipeline cost to the very sectors where the gap is widest.
Employer effort is the missing piece. The CIPD found that only 9% of employers had focused on improving inclusion for social mobility or socio-economic status in the past five years — 17% of large firms against 8% of smaller ones — the lowest priority of any diversity strand. That gap between what young people want and what employers do is why voluntary measurement, an agreed definition of socio-economic background, and the stalled socio-economic duty remain the live questions in this field.
Frequently asked questions
What is the class pay gap in the UK?
The class pay gap is the difference in pay between people from working-class and professional-managerial backgrounds doing the same professional job. In the latest data (Social Mobility Foundation, 2024), professionals from working-class backgrounds are paid £6,291 a year less on average — about 12% — than colleagues from professional-managerial backgrounds in the same occupations.
How much less do working-class professionals earn?
On average £6,291 a year less, or roughly 12% (2024): an average salary of £45,437 against £51,728 for those from professional-managerial origins. The gap rises to £7,774 a year in the private sector and is £6,855 a year for women.
When is Class Pay Gap Day 2026?
The Social Mobility Foundation sets Class Pay Gap Day each mid-November when it publishes fresh pay data — in 2024 it fell on 17 November. The exact 2026 date is confirmed on the Foundation’s Class Pay Gap Day announcement, expected in November 2026; it marks the point from which working-class professionals effectively work unpaid for the rest of the year relative to more advantaged peers.
Do UK employers have to report their class pay gap?
No. Unlike gender pay gap reporting, class or socio-economic pay gap reporting is entirely voluntary — there is no legal duty to measure or publish it. Section 1 of the Equality Act 2010 (a socio-economic duty) was passed but never commenced in England. In 2024, 26 organisations measured their class pay gaps through the Social Mobility Foundation’s Employer Index, rising to 36 in 2025.
Is socio-economic background a protected characteristic?
No. Socio-economic background is not one of the nine protected characteristics under the Equality Act 2010, which is why it is sometimes called the informal ‘tenth protected characteristic’. It shapes pay and progression as strongly as the protected strands but without the same legal protection.
Related guides
- Ethnicity Pay Gap Statistics UK: Gaps by Group, Trends & Mandatory Reporting
- Disability Employment Gap Statistics UK
- Women in Leadership Statistics UK
- Workplace Discrimination Statistics UK: Tribunal Claims, Prevalence & Protected Characteristics
- Equality Act 2010: The Complete UK Guide
Sources & references
- Social Mobility Foundation — The Class Pay Gap / Class Pay Gap Day (2024 pay data; Class Pay Gap Day 17 November 2024)
- Brightmine — Class pay gap: working-class professionals paid 12% less (reporting Social Mobility Foundation 2024 data)
- Social Mobility Commission — State of the Nation 2024 (2022 outcome data)
- GOV.UK / LSE-UCL — New research uncovers class pay gap in Britain’s professions (2017, Labour Force Survey, 90,000+ respondents)
- CIPD — Social mobility in the workplace: removing the ‘class ceiling’
- Progress Together — Shaping the Sector: financial services socio-economic data (2024, ~200,000 employees)
- The Bridge Group — Socio-economic diversity and business benefits research (2025)
- Friedman & Laurison — The Class Ceiling: Why It Pays to Be Privileged (2019)
Socio-economic background shapes pay and progression as powerfully as any protected characteristic — make sure your team understands inclusive practice and the Equality Act 2010 framework it sits within.
Explore the Equality, Diversity & Inclusion course →
Mark writes about equality, diversity and inclusion, UK workplace compliance and accredited online training for Equality, Diversity & Inclusion Training, part of Online CPD Academy.