
There is no single official ‘UK ethnicity pay gap’ figure. The Office for National Statistics deliberately reports pay gaps group by group — and its flagship analysis, covering 2012 to 2022, has not been refreshed since it was published in November 2023. This page gathers the key numbers into one fully cited reference: the ONS group-by-group gaps, the Cabinet Office’s first comprehensive Civil Service ethnicity pay gap bulletin, London’s outsized gap, and the government’s March 2026 confirmation that ethnicity pay gap reporting will become mandatory for large GB employers.
Key facts and figures
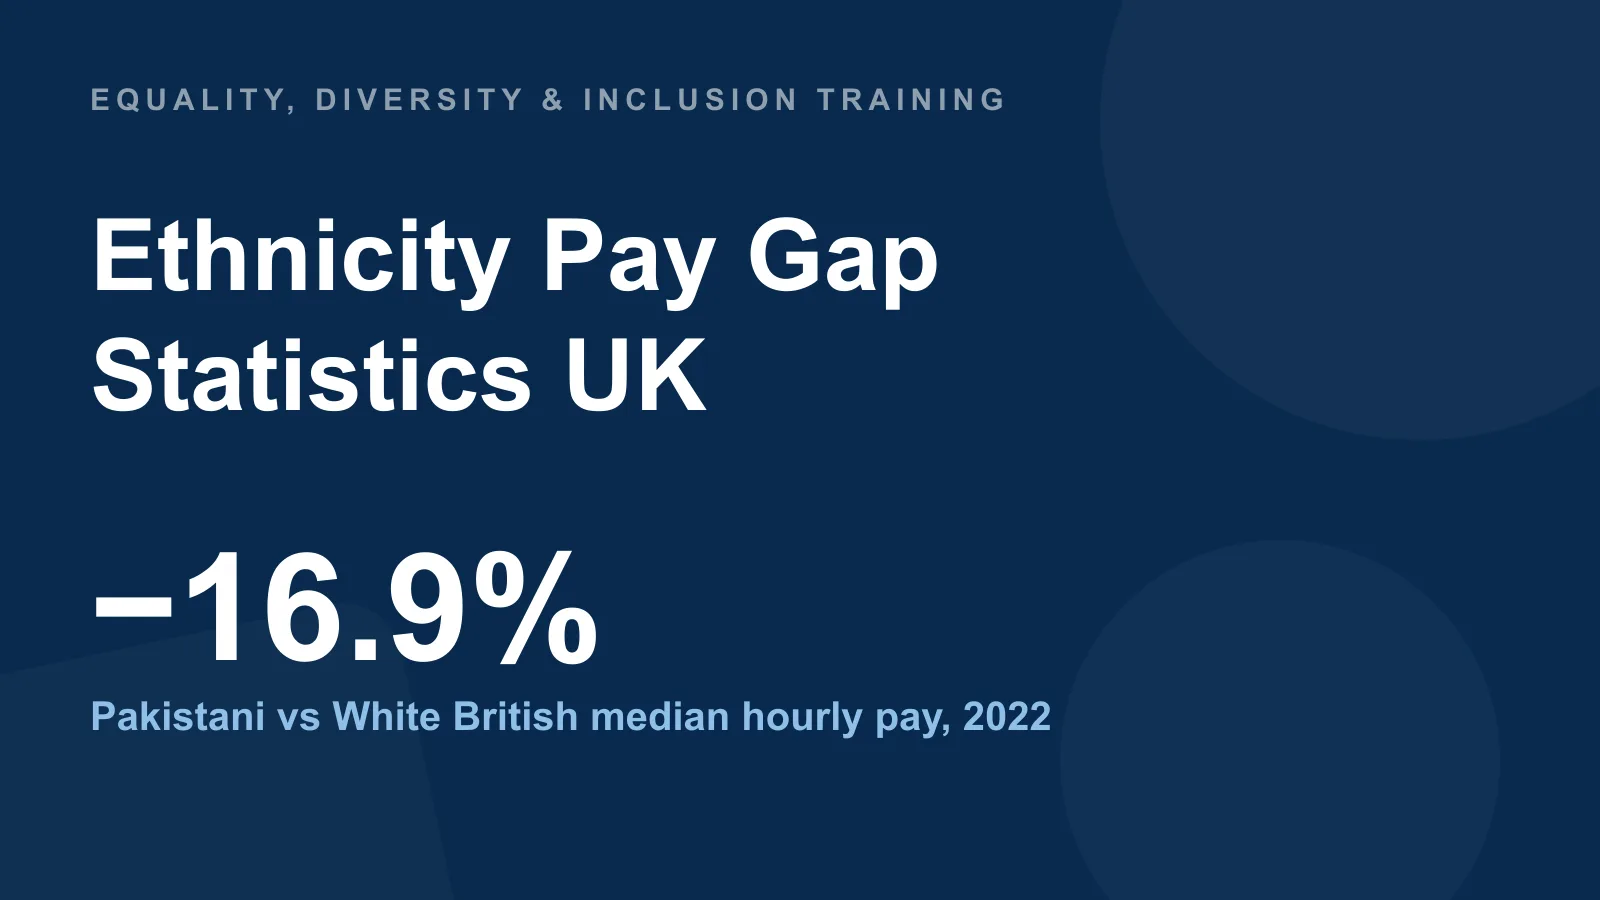
- −16.9% Pakistani employees earned 16.9% less per hour than White British employees — the largest downward gap of the main ethnic groups (median gross hourly pay, 2022).
- −15.3% the equivalent pay gap for Bangladeshi employees against White British (2022).
- +23% Chinese employees earned a median £17.73 an hour, roughly 23% more than White British employees’ £14.42 (2022).
- ~5.7% the gap for Black employees (£13.53 vs £14.35 for White employees, 2022) — the only group earning less than White employees in every year from 2012 to 2022.
- 22%+ the median hourly pay gap between White and Black, Asian and minority-ethnic employees in London, against around 1% in England & Wales outside the capital (series to 2022).
- 250+ employees is the threshold at which ethnicity pay gap reporting will become mandatory for GB employers, confirmed by the government on 25 March 2026.
- 87% of the 857 responses to the government consultation backed mandatory ethnicity pay gap reporting (March 2026).
- 23% of employers were calculating their ethnicity pay gap by 2020, up from 5% in 2018 — and 40% of those published it voluntarily.
These are the latest figures available as of July 2026. The main scheduled refresh is the Cabinet Office’s annual Civil Service ethnicity pay gap bulletin each autumn, alongside milestones for the Equality (Race and Disability) Bill — the ONS flagship series has no announced refresh date.
Why is there no single UK ethnicity pay gap figure?
The ONS does not publish one headline ethnicity pay gap. Its flagship analysis, Ethnicity pay gaps, UK: 2012 to 2022 (published 29 November 2023), reports median gross hourly pay for each ethnic group separately, because a single average would cancel groups earning well above the White British median against groups earning far below it. Chinese and Indian employees consistently out-earn White British employees, while Pakistani and Bangladeshi employees earn markedly less; folding all of that into one number would suggest a modest gap and hide both extremes. Any page quoting ‘the UK ethnicity pay gap’ as a single percentage is simplifying beyond what the official data supports.
The state of the official data is itself a headline. The 2022 figures published in November 2023 remain the most recent comprehensive ONS analysis, with no refresh announced since, and the government’s own Ethnicity facts and figures service still shows 2021 data on average hourly pay (published July 2022). Until mandatory employer reporting begins, the UK’s ethnicity pay evidence base is official, detailed — and frozen in the early 2020s.
Which ethnic groups face the largest pay gaps?
Pakistani employees earned 16.9% less than White British employees in 2022, the largest downward gap among the main ethnic groups in the ONS’s 18-group analysis of median gross hourly pay for England and Wales. Bangladeshi employees earned 15.3% less (2022). Among the Mixed groups, employees of Mixed White and Black Caribbean ethnicity had the lowest median hourly earnings at £11.75 — an 18.5% gap to the White British median of £14.42 (2022).
The distribution runs in both directions. Chinese employees earned a median £17.73 an hour in 2022 — roughly 23% more than White British employees — and have earned more than White British employees in every year since 2012. Indian employees earned a median £17.29, about 20% above the White British figure (2022).
| Ethnic group | Median hourly pay (2022) | Gap vs White British |
|---|---|---|
| Chinese | £17.73 | +23% (earns more) |
| Indian | £17.29 | +20% (earns more) |
| White British (comparator) | £14.42 | — |
| Bangladeshi | – | −15.3% |
| Pakistani | – | −16.9% |
| Mixed White and Black Caribbean | £11.75 | −18.5% |
Figures are median gross hourly pay from the ONS 18-ethnic-group analysis for England and Wales, 2022; positive percentages are rounded as reported by the ONS. An older but complementary dataset points the same way: on the government’s Ethnicity facts and figures service (2021 data, published July 2022 — still the latest on that page), combined Pakistani and Bangladeshi employees had the lowest average hourly pay of any ethnic group at £12.03, White Irish the highest at £18.14, with White British at £13.46.
On what drives the gaps, the Equality and Human Rights Commission’s research report The ethnicity pay gap (Longhi & Brynin, 2017) found that differences in occupation, qualifications and location explain part of the disparities — but not all of them, leaving an unexplained residual for several groups even after those characteristics are taken into account.
What is the pay gap for Black employees?
Black, African, Caribbean or Black British employees earned a median £13.53 an hour in 2022, against £14.35 for White employees — a gap of around 5.7% (UK-level ONS analysis). More striking than the size of the gap is its persistence: Black employees were the only ethnic group to earn less than White employees in every single year of the 2012 to 2022 series.
The gap also survives statistical adjustment. In the ONS’s adjusted analysis, UK-born Black, African, Caribbean or Black British employees earned 5.6% less than UK-born White employees in 2022 even after controlling for pay-determining characteristics such as occupation and qualifications — meaning the disparity is not simply a composition effect of who works in which jobs.
Race is a protected characteristic under the Equality Act 2010, and where pay disparities tip into unlawful treatment they surface as race discrimination claims — tribunal volumes and awards are covered in our workplace discrimination statistics page rather than here.
Why is the ethnicity pay gap so much larger in London?
In London the median hourly pay gap between White employees and Black, Asian and minority-ethnic employees is more than 22% — compared with around 1% across England and Wales outside the capital, according to the GLA London Datastore’s analysis of the Annual Population Survey (series January 2014 to December 2022).
The concentration effect is the single most important thing to understand when benchmarking: London combines the country’s highest-paying industries with its most ethnically diverse workforce, and minority-ethnic employees in the capital are under-represented in the top-paying roles within those industries. A national comparison therefore flatters London employers — an organisation based in the capital that benchmarks its own ethnicity pay gap against a near-zero rest-of-Britain figure is measuring itself against the wrong yardstick. Regional context belongs next to any employer’s published number.
What does the Civil Service ethnicity pay gap show?
The Cabinet Office published the first comprehensive Civil Service ethnicity pay gap bulletin in 2025, covering data at 31 March 2025 — the largest single-employer ethnicity pay analysis in the UK, and the closest preview yet of what mandatory reporting will produce across the economy. It found a median pay gap of 4.5% for Asian civil servants and 4.5% for Black civil servants compared with White colleagues, with a mean gap of 7.9% for Black civil servants (2025).
Bonus pay showed much larger disparities than base pay: median bonus payments were 42.9% lower for Black civil servants and 29.1% lower for Asian civil servants than for White civil servants (2025). That pattern — modest hourly-pay gaps concealing much wider bonus gaps — is exactly the kind of finding the six-measure reporting framework is designed to expose, and it is why bonus figures are reported separately rather than folded into a single number.
The bulletin is scheduled to refresh annually each autumn, making it the most reliable recurring source of new UK ethnicity pay data until mandatory employer reporting begins.
When will ethnicity pay gap reporting become mandatory?
On 25 March 2026 the government confirmed that ethnicity pay gap reporting will become mandatory for GB employers with 250 or more employees, in its response to the consultation on the Equality (Race and Disability) Bill. The consultation drew 857 responses, 87% of which backed mandatory ethnicity reporting. Reporting is voluntary today — the confirmation sets the direction, but the duty itself needs the Bill to pass and be commenced, which is realistically not before 2027; no fixed start date has been announced.
The framework copies the one already used for gender pay gap reporting — the same six measures, reporting dates and portal (the gender pay gap itself is measured annually by the ONS and sits outside the scope of this page) — and then goes further: employers will also need to publish action plans, report their workforce composition and declaration rates, and calculate gaps against multiple comparator groups rather than a single binary split. The same Bill makes disability pay gap reporting mandatory for the same employers — we cover the disability side in our disability employment gap statistics page.
The government’s final stage impact assessment (25 March 2026) sets out the scale: around half of UK employees work for organisations with 250 or more employees, so the duty will cover roughly half the workforce despite applying to a minority of employers. It estimates a recurring administrative cost of £18.8 million per year, a 10-year net present value to business of −£161 million, and assumes 75% employer compliance in year one.
How many employers already report their ethnicity pay gap?
23% of employers surveyed by PwC were calculating their ethnicity pay gap in 2020, up from just 5% in 2018 — and of those that calculated it, 40% published the results voluntarily. The research is now dated (the survey ran in 2020), but it remains the most robust benchmark of voluntary uptake: no official count of voluntary ethnicity pay gap reporters exists.
The gap between calculating and publishing points at the practical obstacles mandatory reporting will need to solve: employers cannot compel staff to declare their ethnicity, small numbers in some groups make single-year figures volatile, and multiple comparator groups make the results harder to summarise than a one-number gender gap. Those are precisely the issues the 2026 framework addresses by requiring declaration rates and workforce composition to be published alongside the gaps themselves.
Once the first mandatory reporting cycle lands — plausibly the 2027–28 reporting year — the UK will gain a rich annual employer-level dataset, transforming a field that currently relies on an unrefreshed 2022 ONS analysis and a single 2020 uptake survey.
Frequently asked questions
What is the ethnicity pay gap in the UK?
There is no single official figure — the ONS reports pay gaps group by group. In the latest data (2022, published November 2023), Pakistani employees earned 16.9% less and Bangladeshi employees 15.3% less than White British employees, while Chinese employees earned roughly 23% more and Indian employees about 20% more. Black employees earned around 5.7% less than White employees.
Is ethnicity pay gap reporting mandatory in the UK?
Not yet — reporting is voluntary today. On 25 March 2026 the government confirmed that ethnicity pay gap reporting will become mandatory for GB employers with 250 or more employees, through the Equality (Race and Disability) Bill.
When will mandatory ethnicity pay gap reporting start?
No fixed date has been set. The duty requires the Equality (Race and Disability) Bill to pass and be commenced, which is realistically not before 2027 — with the first full reporting cycle likely in 2027–28.
Which ethnic groups face the largest pay gaps in the UK?
In the ONS’s 2022 analysis, employees of Mixed White and Black Caribbean ethnicity had an 18.5% gap to White British pay, Pakistani employees 16.9% and Bangladeshi employees 15.3%. At the other end, Chinese and Indian employees earned more than White British employees — roughly 23% and 20% more respectively.
How will ethnicity pay gap reporting differ from gender pay gap reporting?
It uses the same six measures, reporting dates and portal, but adds mandatory action plans, publication of workforce composition and ethnicity declaration rates, and calculations against multiple comparator groups rather than a single binary comparison.
Related guides
- Workplace Discrimination Statistics UK: Tribunal Claims, Prevalence & Protected Characteristics
- Disability Employment Gap Statistics UK
- Women in Leadership Statistics UK
- Equality Act 2010: The Complete UK Guide
- The Nine Protected Characteristics Under the Equality Act 2010
Sources & references
- ONS — Ethnicity pay gaps, UK: 2012 to 2022 (published 29 November 2023)
- Office for Equality and Opportunity (GOV.UK) — Consultation on mandatory ethnicity and disability pay gap reporting: government response (25 March 2026)
- GOV.UK — Final stage impact assessment: mandatory ethnicity and disability pay gap reporting (25 March 2026)
- Cabinet Office — Civil Service ethnicity pay gap statistics 2025 (data at 31 March 2025)
- GOV.UK Ethnicity facts and figures — Average hourly pay (2021 data, published July 2022)
- GLA London Datastore — Ethnicity pay gaps in London (APS series to December 2022)
- EHRC — Research report 108: The ethnicity pay gap (Longhi & Brynin, 2017)
- PwC — Increasing number of employers calculating ethnicity pay gap (2020 survey)
Mandatory pay gap reporting will put every large employer’s numbers in public view — make sure your team understands the Equality Act 2010 and inclusive practice before the data does the talking.
Explore the Equality, Diversity & Inclusion course →
Mark writes about equality, diversity and inclusion, UK workplace compliance and accredited online training for Equality, Diversity & Inclusion Training, part of Online CPD Academy.