
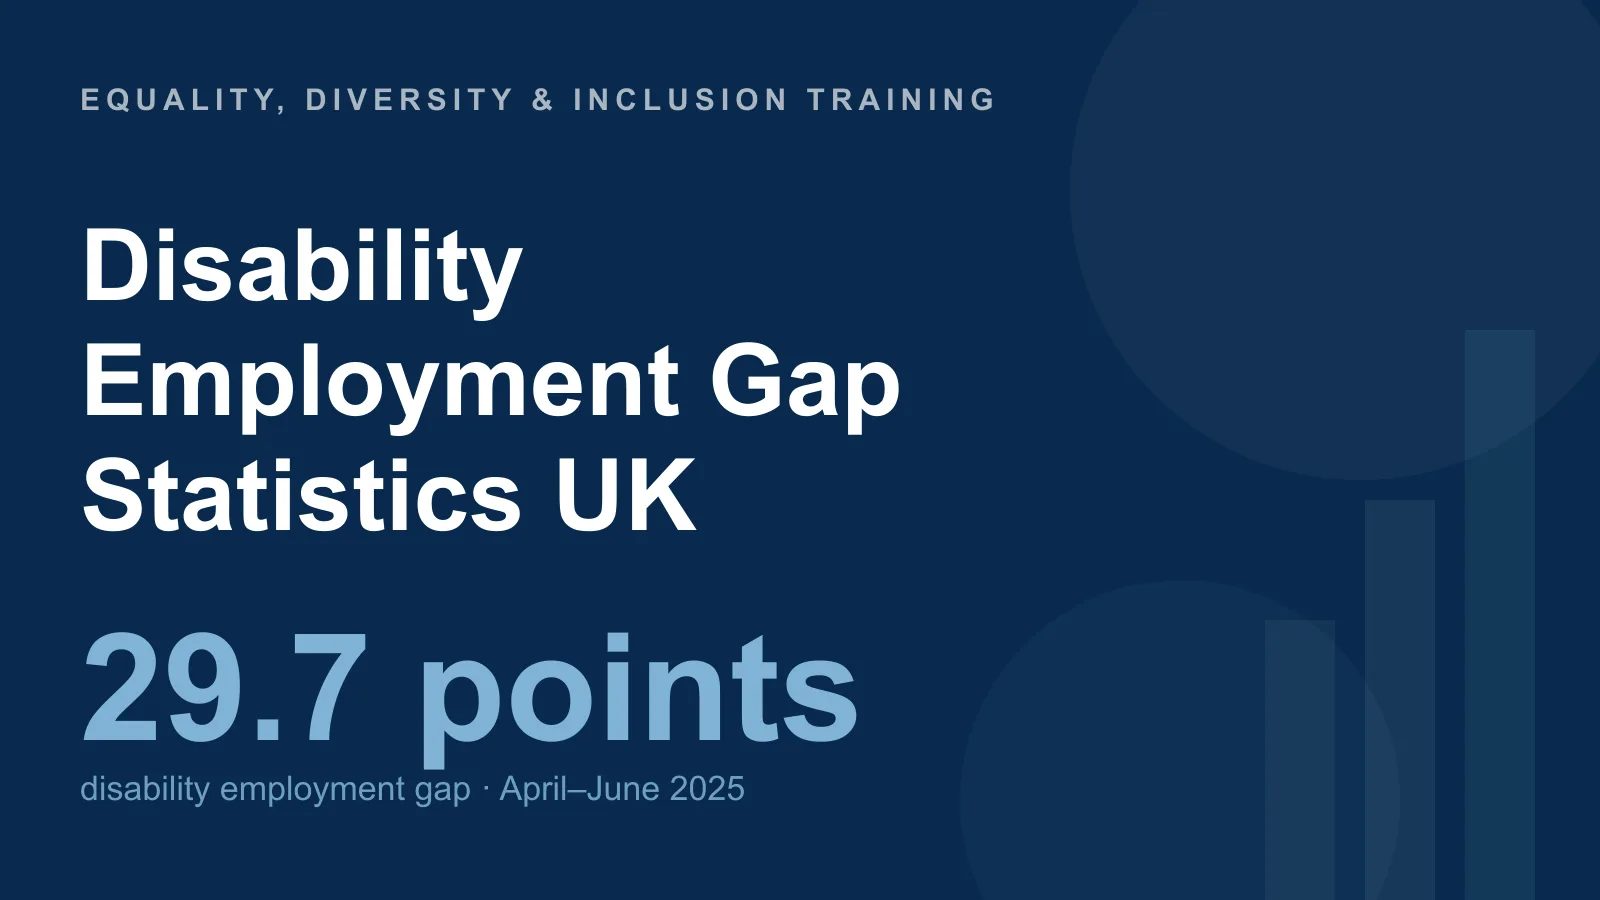
The disability employment gap — the difference between the employment rates of disabled and non-disabled people — is one of the most closely watched equality measures in the UK, and in 2025 it began moving in the wrong direction. This page gathers the headline numbers into one fully cited reference: the gap itself, the employment and inactivity rates behind it, the disability pay gap, and the breakdowns by sex, age and condition. Every figure comes from a named official or authoritative source — chiefly the Department for Work and Pensions’ annual The employment of disabled people release, the ONS A08 labour market dataset, the ONS disability pay gaps analysis and the House of Commons Library — with the data period stated alongside it.
Key facts and figures
- 29.7 percentage points — the UK disability employment gap: 52.8% of disabled people aged 16–64 in work vs 82.5% of non-disabled people (April–June 2025).
- 5.5 million disabled people were in employment in mid-2025 — the first year-on-year fall in that number since at least 2013.
- 10.4 million working-age people are disabled — nearly 1 in 4 of the UK working-age population (2025).
- 16.7 million people in the UK are disabled — 25% of the population (Family Resources Survey, 2024/25).
- 4.2 million working-age people are both disabled and economically inactive (April–June 2025).
- 12.7% — the median disability pay gap: disabled employees earned £13.69 an hour vs £15.69 for non-disabled employees (ONS, 2023).
- £2.24 an hour — the disability pay gap on the TUC’s 2025 measure (15.5%), worth over £4,000 a year.
- 31.4% — the employment rate for autistic people, the lowest of any impairment group (2024/25).
These figures are the latest available as of July 2026. The main refresh points are the DWP’s annual The employment of disabled people release and the quarterly ONS A08 dataset, whose next update is due on 18 August 2026; this page is updated as new editions land.
What is the disability employment gap in the UK?
The disability employment gap was 29.7 percentage points in April–June 2025: 52.8% of disabled people aged 16–64 were in employment, compared with 82.5% of non-disabled people, according to the DWP’s The employment of disabled people 2025. The gap widened by 1.1 percentage points on the year — a change the DWP notes is not statistically significant in itself, but one that fits a broader pattern of deterioration in the most recent data.
One caution for anyone citing these numbers: the UK publishes the gap on two different official measures, and they should never be mixed in a single chart or comparison. The DWP’s annual release uses ages 16–64 and put the gap at 29.7 percentage points in April–June 2025. The DWP’s Get Britain Working: Labour Market Insights series uses ages 18–66 to match the State Pension age, and on that basis the gap was 31.2 percentage points in October–December 2025, also up 1.1 points on the year. Both are legitimate; they simply answer slightly different questions. Pick one measure and label it.
The table below shows the headline picture on the DWP’s standard 16–64 measure.
| Measure (ages 16–64) | Figure | Data period / note |
|---|---|---|
| Disabled employment rate | 52.8% | April–June 2025 |
| Non-disabled employment rate | 82.5% | April–June 2025 |
| Disability employment gap | 29.7pp | Widened 1.1pp year-on-year (not statistically significant) |
| Disabled people in employment | 5.5 million | First year-on-year fall since at least 2013 |
| Working-age disabled people | 10.4 million | Nearly 1 in 4 of the working-age population, 2025 |
| Disabled and economically inactive | 4.2 million | April–June 2025 |
| Disabled workers working part-time | 31.9% | vs 21.1% of non-disabled workers, 2024/25 |
The underlying quarterly series is the ONS’s A08: labour market status of disabled people dataset, most recently released on 19 May 2026 with data to January–March 2026, and next updated on 18 August 2026.
How many disabled people are in work in the UK?
5.5 million disabled people aged 16–64 were in employment in April–June 2025, according to the DWP’s 2025 annual release. What makes that figure historic is the direction of travel: it represents the first year-on-year fall in the number of disabled people in work since at least 2013. For over a decade, rising disability prevalence meant the number of disabled people in employment climbed steadily even when the employment rate was flat; in 2025 the count itself went into reverse.
The population behind these figures is large and growing. 10.4 million working-age people are disabled — nearly 1 in 4 of the UK working-age population (DWP, 2025). Across all ages, the DWP’s Family Resources Survey 2024/25 (published 26 March 2026) puts the total at 16.7 million disabled people — 25% of the UK population, and 23% of working-age adults.
Working patterns differ markedly too: 31.9% of disabled workers work part-time, compared with 21.1% of non-disabled workers (2024/25). That difference feeds directly into the pay gap figures covered below, since part-time work is concentrated in lower-paid roles. For a regularly updated narrative treatment of the employment series, the House of Commons Library’s briefing Disabled people in employment (CBP-7540) is the standard reference, most recently updated with July–September 2025 Labour Force Survey data.
How many disabled people are economically inactive?
4.2 million working-age people were both disabled and economically inactive in April–June 2025 — neither in work nor looking for it — according to the DWP’s 2025 release. Among economically inactive disabled people, 59.0% cite long-term sickness as the main reason for being out of the labour market (April–June 2025), far ahead of study, caring or early retirement.
The wider inactivity picture is the core concern of the Government’s Get Britain Working agenda. On that series’ 18–66 measure, economic inactivity due to long-term sickness stood at 6.7% of all 18–66-year-olds in October–December 2025 — 1.5 percentage points above pre-pandemic (October–December 2019) levels (DWP, Get Britain Working Labour Market Insights, April 2026 edition). That post-pandemic step change in long-term-sickness inactivity is the single biggest reason the disability employment numbers have stopped improving.
Inactivity statistics deserve careful handling: they describe people’s current labour-market status, not their capability or ambition. Survey after survey finds a substantial share of economically inactive disabled people would like to work if the right role, adjustments and flexibility were available — which is why the duty to make reasonable adjustments under the Equality Act 2010 sits at the centre of most policy responses.
What is the disability pay gap in the UK?
The median disability pay gap was 12.7% in 2023: disabled employees earned £13.69 an hour on average, against £15.69 for non-disabled employees, according to the ONS’s Disability pay gaps in the UK: 2014 to 2023 — published in October 2024 and still the latest edition of the official analysis as of July 2026. The ONS data shows the gap is wider for disabled men (15.5%) than disabled women (9.6%), and widest of all for autistic employees (27.9%) and employees with epilepsy (26.9%) — condition-level pay detail we cover on our neurodiversity statistics page.
The TUC publishes its own annual analysis each November to mark Disability Pay Gap Day. Its 2025 edition, using Labour Force Survey data from Q3 2024 to Q2 2025, put the gap at 15.5% — £2.24 an hour, or over £4,000 a year for a full-time worker — down from 17.2% the year before (TUC, November 2025). On the TUC’s calculation, Disability Pay Gap Day fell on 12 November 2025 — the point in the year at which disabled workers effectively stop being paid relative to non-disabled workers. The same analysis found non-disabled men earn 27.3% more than disabled women, the widest comparison in the dataset.
The ONS and TUC figures differ because they use different datasets, periods and controls — cite whichever you use with its source and year rather than averaging them. Note that the gender pay gap is measured separately through the ONS’s annual dedicated release and is outside the scope of this page.
Which disabled people face the largest gaps?
The disability employment gap is larger for men (30.3 percentage points) than for women (23.1 points), according to the DWP’s 2024/25 analysis — largely because non-disabled men have a very high employment rate, so disabled men fall further short of their peers.
The gap also grows steadily with age: 21.1 percentage points among 18–24-year-olds, rising to 32.5 points among 50–64-year-olds (2024/25). Health conditions accumulate with age while workplace flexibility often doesn’t, and older workers who leave employment for health reasons are the least likely to return.
Employment rates also vary enormously by impairment type — from 31.4% for autistic people, the lowest of any group, to 68.8% for people with stomach, liver, kidney or digestive conditions, the highest (2024/25). That 37-point spread within the disabled population is itself wider than the headline gap between disabled and non-disabled people. Condition-by-condition employment and pay detail — including the autism, ADHD and dyslexia employment picture — belongs to our neurodiversity statistics page rather than this one.
Why is the disability employment gap widening?
The gap widened by 1.1 percentage points on both official measures in the latest data — to 29.7 points on the DWP’s 16–64 measure (April–June 2025) and 31.2 points on the 18–66 Get Britain Working measure (October–December 2025). Three forces stand out in the official data.
First, the employment count has turned. The number of disabled people in work fell year-on-year in 2025 for the first time since at least 2013, even as non-disabled employment held up — so the gap widened from both ends. Second, long-term-sickness inactivity remains elevated: at 6.7% of 18–66-year-olds in October–December 2025, it is still 1.5 percentage points above its pre-pandemic level, and 59.0% of economically inactive disabled people name long-term sickness as their main reason for being out of the labour market. Third, disability prevalence keeps rising — 10.4 million working-age people, nearly 1 in 4, now report a disability — which changes the composition of the disabled population faster than workplaces adapt.
Employer-side pressure is rising at the same time: disability discrimination tribunal complaints rose 79% year-on-year in early 2026, a trend we track in our workplace discrimination statistics page. On the voluntary side, around 19,000 employers — covering more than 11 million employees — were signed up to the Government’s Disability Confident scheme as of January 2026.
When will disability pay gap reporting become mandatory?
Mandatory disability pay gap reporting for large employers is coming. On 25 March 2026 the Government published its consultation response confirming plans to require large employers to report their disability (and ethnicity) pay gaps, with the legal framework carried in the Equality (Race and Disability) Bill. Once the first reporting cycles complete, the UK will gain an entirely new annual data stream — employer-level disability pay gap figures comparable to the existing gender pay gap regime — expected from around 2027 onwards.
For HR and compliance teams, the practical implication is that disability pay data will move from a voluntary, survey-based national estimate to a published, name-attached employer obligation. This section will be expanded with the first reported figures as soon as they are published; until then, the ONS and TUC analyses above remain the best available national measures.
Frequently asked questions
What is the disability employment gap in the UK?
The disability employment gap is the difference between the employment rates of disabled and non-disabled people. In April–June 2025 it stood at 29.7 percentage points on the DWP’s standard 16–64 measure — 52.8% of disabled people in work against 82.5% of non-disabled people. On the Get Britain Working 18–66 measure it was 31.2 percentage points in October–December 2025.
What percentage of disabled people are in work in the UK?
52.8% of disabled people aged 16–64 were in employment in April–June 2025, compared with 82.5% of non-disabled people (DWP, The employment of disabled people 2025). That equates to 5.5 million disabled people in work.
What is the disability pay gap in the UK?
The ONS put the median disability pay gap at 12.7% in 2023 — £13.69 an hour for disabled employees against £15.69 for non-disabled employees. The TUC’s 2025 analysis, using a different method and more recent Labour Force Survey data, put it at 15.5%, or £2.24 an hour — over £4,000 a year.
How many disabled people are there in the UK?
16.7 million people — 25% of the UK population — were disabled in 2024/25, according to the DWP’s Family Resources Survey. Among working-age people the total is 10.4 million, nearly 1 in 4, and 4.2 million of them are economically inactive.
Why is the disability employment gap widening?
The gap widened by 1.1 percentage points year-on-year on both official measures in the latest data. The number of disabled people in employment fell in 2025 for the first time since at least 2013, economic inactivity due to long-term sickness remains 1.5 percentage points above pre-pandemic levels, and disability prevalence is rising faster than workplaces are adapting.
Related guides
- Workplace Discrimination Statistics UK: Tribunal Claims, Prevalence & Protected Characteristics
- Neurodiversity Statistics UK: Autism, ADHD & Dyslexia Prevalence and Employment
- Ethnicity Pay Gap Statistics UK
- Reasonable Adjustments Under the Equality Act 2010: A UK Employer’s Guide
- Equality Act 2010: The Complete UK Guide
Sources & references
- DWP — The employment of disabled people 2025
- ONS — A08: Labour market status of disabled people (dataset)
- DWP — Get Britain Working: Labour Market Insights, April 2026
- ONS — Disability pay gaps in the UK: 2014 to 2023
- House of Commons Library — Disabled people in employment (CBP-7540)
- DWP — Family Resources Survey 2024/25
- TUC — Disability pay gap analysis, Disability Pay Gap Day (November 2025)
- GOV.UK — Employers signed up to Disability Confident
Closing the gap starts inside the workplace — train your team on the Equality Act 2010, reasonable adjustments and disability-inclusive practice.
Explore the Equality, Diversity & Inclusion course →
Mark writes about equality, diversity and inclusion, UK workplace compliance and accredited online training for Equality, Diversity & Inclusion Training, part of Online CPD Academy.