
The official picture of ethnic diversity at work in the UK is spread across several datasets that rarely sit side by side. This page pulls them into one cited reference: the working-age population share from the Census 2021, the employment and unemployment gaps by ethnic group from ONS dataset A09 and the government’s Ethnicity facts and figures service, and boardroom representation from the Parker Review. Together they show a workforce that is far more diverse than a decade ago, yet still marked by persistent gaps in who gets hired, who reaches senior roles, and who sits on the board.
Key facts and figures
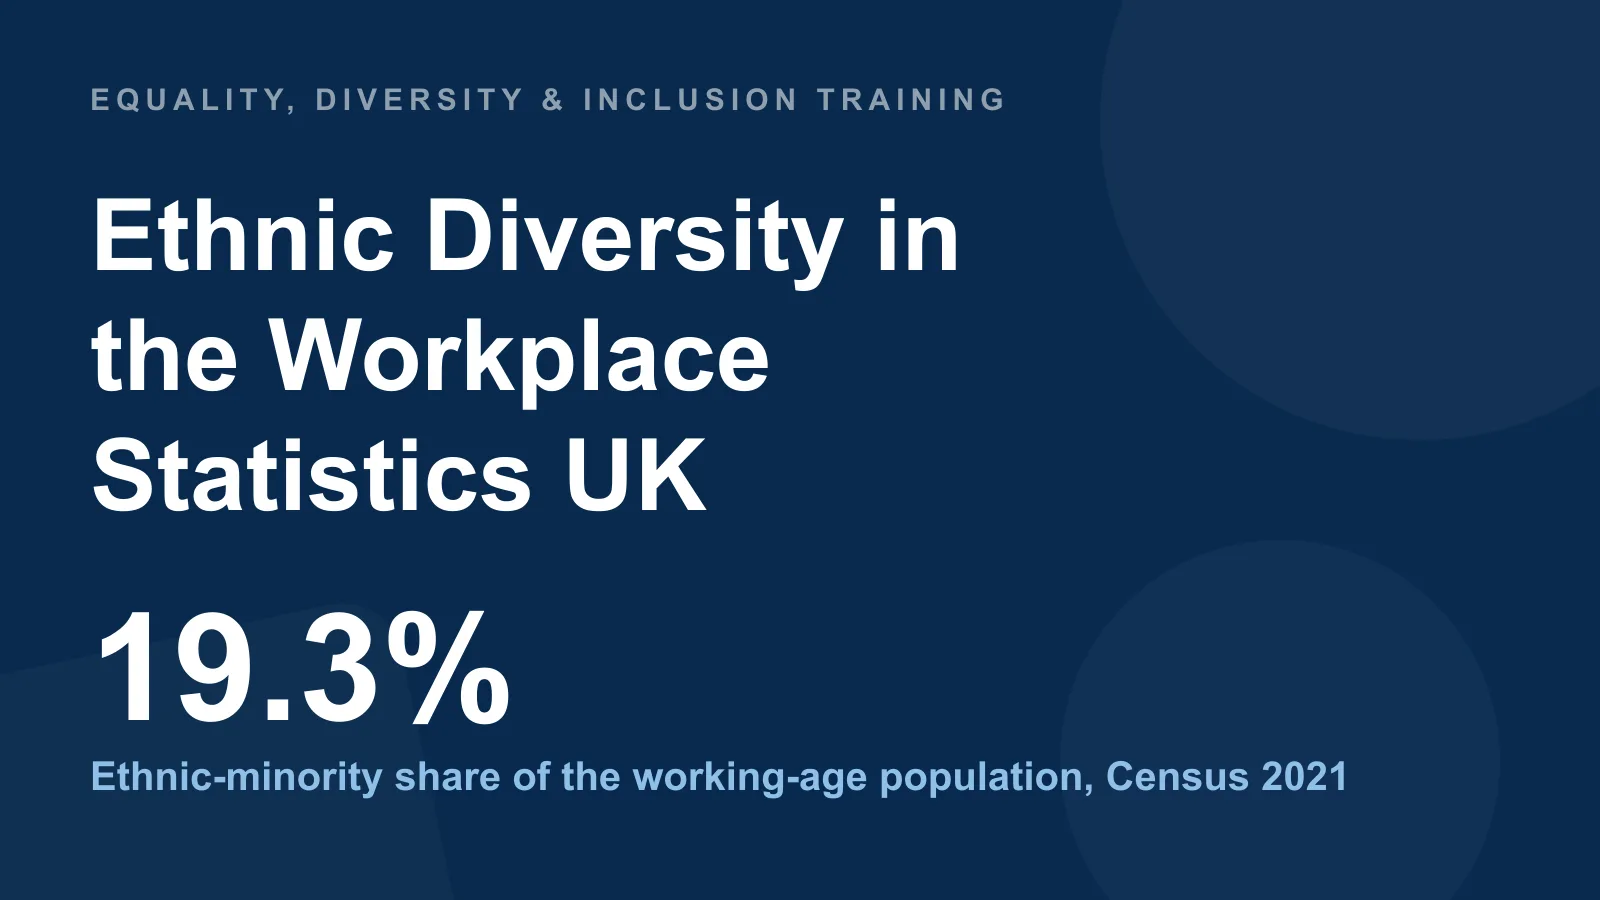
- 19.3% of the working-age (16–64) population of England and Wales were from an ethnic minority background — 7.2 million people against 30.2 million (80.7%) from White ethnic groups (Census 2021).
- 8.8% vs 4.3% unemployment rate for people from minority-ethnic backgrounds against White people — a gap of 4.5 percentage points (Jul–Sep 2025).
- 8 points broad-group employment gap: 77% of White people were in work against 69% of all other ethnic groups combined (2022).
- 37.4% employment rate for the White Gypsy or Irish Traveller group — the lowest of any detailed group, against 74.4% for the highest, White Other (Census 2021).
- 39.8% of Indian workers were in professional occupations, while just 4.6% of Black workers held managerial roles (2021).
- 98% of FTSE 100 companies now have at least one ethnic-minority director, up from 52% in 2019 (Parker Review, March 2026).
- 2.3% of FTSE 100 board positions were held by Black directors — below their 3.9% share of the general population (Parker Review, March 2026).
- 11% of UK-based FTSE 100 senior management were from an ethnic-minority background, with Black senior managers at just 1.3% (Parker Review, March 2026).
These are the latest figures available as of July 2026. The unemployment gap refreshes quarterly through ONS dataset A09 (next release 18 August 2026, Feb/May/Aug/Nov), while the Parker Review updates the FTSE board figures every March; the Census-based population and employment-rate breakdowns hold until the next census.
What share of the UK workforce is from an ethnic-minority background?
Ethnic minorities made up 19.3% of the working-age population of England and Wales at the 2021 Census — 7.2 million people out of 37.4 million aged 16 to 64. The remaining 30.2 million (80.7%) were from White ethnic groups. That is a substantial rise on a decade earlier and is the reason older reference figures — the frequently repeated ‘around 15% of the working-age population’ — now understate the true share.
The working-age share matters because it is the correct benchmark for judging workplace representation. An organisation that draws its staff from England and Wales and employs materially fewer than roughly one in five people from an ethnic-minority background is under-representing the labour pool it recruits from, not matching it. The share is also younger on average than the White population, so the ethnic-minority proportion of new entrants to the labour market is higher still — a gap between workforce composition today and the pipeline arriving tomorrow.
What is the ethnicity employment gap in the UK?
77% of White people were in employment in 2022, compared with 69% of people from all other ethnic groups combined — a broad-group employment gap of 8 percentage points, on the government’s Ethnicity facts and figures service. The gap has narrowed over the long run but has proved stubborn: it reflects differences in who is in work at all, before any question of pay or seniority.
The picture varies sharply once the broad ‘all other’ category is unpacked. Employment rates by broad group in 2022 ran White 77%, Asian 70%, Black 69%, Mixed 69% and Other 68%. Within those, the combined Pakistani and Bangladeshi group had the lowest broad-detail employment rate at 61% — 16 points below the White figure. Much of that difference is driven by economic inactivity rather than unemployment alone (see below), which is why employment rate and unemployment rate tell related but distinct stories.
| Broad ethnic group | Employment rate (2022) | Gap vs White |
|---|---|---|
| White | 77% | — |
| Asian | 70% | −7 pts |
| Black | 69% | −8 pts |
| Mixed | 69% | −8 pts |
| Other | 68% | −9 pts |
| Pakistani/Bangladeshi (detail) | 61% | −16 pts |
Figures are employment rates for those aged 16 to 64 from the government’s Ethnicity facts and figures service, 2022 (Annual Population Survey). This page carries employment and representation data only — ethnicity pay figures live on our ethnicity pay gap statistics page, where Pakistani employees earn 16.9% less than White British as the headline number.
How large is the ethnic-minority unemployment gap?
The UK unemployment rate was 8.8% for people from minority-ethnic backgrounds against 4.3% for White people in Jul–Sep 2025 — a gap of 4.5 percentage points, according to ONS dataset A09 as tracked by the House of Commons Library. Minority-ethnic workers were, in other words, more than twice as likely to be unemployed as White workers. The overall UK unemployment rate over the same period was 5.1%.
Unlike the Census-based employment rates, this figure is refreshed quarterly, which makes it the single most useful number for tracking whether the labour market is closing or widening the ethnic gap over time. Because it is drawn from a survey, quarter-to-quarter movements for smaller ethnic groups can be volatile, so the broad minority-versus-White comparison is more reliable than any single detailed group in a single quarter. The gap has narrowed from the double-digit minority unemployment rates seen in the early 2010s, but it has not closed, and it typically widens fastest for minority workers when the wider labour market weakens.
Which ethnic groups have the highest and lowest employment rates?
At the detailed group level, the White Other group had the highest employment rate at 74.4% and the White Gypsy or Irish Traveller group the lowest at 37.4%, according to the ONS’s Census 2021 analysis of the labour market in England and Wales — a spread of 37 percentage points between the top and bottom detailed groups. The White Gypsy or Irish Traveller figure is the starkest single employment-rate statistic in the official data and is often overlooked because it sits inside the broad ‘White’ category that otherwise records the highest overall rate.
Economic inactivity — people who are neither working nor looking for work, such as those studying, caring for family or long-term unwell — explains much of the variation. In 2022, 21% of White people were economically inactive against 26% of all other ethnic groups combined. The Pakistani/Bangladeshi group was highest at 33% and the White Other group lowest at 15%. A high inactivity rate depresses the employment rate without ever appearing in the unemployment figures, which count only those actively seeking work — one reason the Pakistani/Bangladeshi employment rate is so much lower than the headline gap alone would suggest.
Are ethnic-minority workers concentrated in particular occupations?
Indian workers were the most likely of any group to be in professional occupations, at 39.8%, while Black workers were the least likely to hold managerial roles, at 4.6% (2021, Ethnicity facts and figures, employment by occupation). The occupation data is where the diversity story becomes a seniority story: representation in the workforce does not translate evenly into representation in the better-paid, higher-status roles.
At the other end of the occupational ladder, 33.9% of workers from the combined Pakistani and Bangladeshi group were in the three lowest occupation categories — elementary occupations; sales and customer service; and process, plant and machine operatives (2021). Occupational sorting of this kind is one of the mechanisms behind the pay differences reported elsewhere: where a group is over-represented in lower-paid occupation bands and under-represented in professional and managerial ones, a pay gap follows almost mechanically, before any question of unequal treatment for the same work.
| Occupation measure (2021) | Group | Figure |
|---|---|---|
| In professional occupations (highest) | Indian | 39.8% |
| In managerial roles (lowest) | Black | 4.6% |
| In the three lowest occupation categories | Pakistani/Bangladeshi | 33.9% |
How much of this reflects hiring-stage bias — for example, identical CVs receiving fewer callbacks under an ethnic-minority name — is a separate question addressed by dedicated field experiments rather than this representation data, and where disparities cross into unlawful treatment they surface as race-discrimination claims, covered in our workplace discrimination statistics page.
How many FTSE 100 boards have an ethnic-minority director?
98% of FTSE 100 companies had at least one ethnic-minority director by the March 2026 Parker Review, up from just 52% in 2019. On the Review’s original benchmark — every FTSE 100 board to have at least one ethnic-minority director — the target is now within a single company of being met. Ethnic-minority directors held 20% of all FTSE 100 directorships, up from 19% in 2024.
The improvement has spread down the index. 82% of FTSE 250 companies had at least one ethnic-minority director by March 2026, up from 22% in 2019, and ethnic minorities held 16% of FTSE 250 director positions. That is one of the fastest shifts in boardroom composition the UK has recorded, driven by the Review’s voluntary ‘comply or explain’ targets rather than legislation.
| Parker Review measure | 2019 | March 2026 |
|---|---|---|
| FTSE 100 boards with ≥1 ethnic-minority director | 52% | 98% |
| FTSE 250 boards with ≥1 ethnic-minority director | 22% | 82% |
| Ethnic-minority share of FTSE 100 directorships | — | 20% |
| Ethnic-minority share of FTSE 250 directorships | — | 16% |
The headline count carries the same caveat every diversity benchmark does: a board can clear a ‘one director’ threshold while remaining overwhelmingly homogeneous, which is why the Review now also tracks senior-management pipelines and specific under-represented groups rather than the board-tick alone. The Parker Review deliberately carries the ethnic board figures; gender board and leadership representation is tracked separately in our women in leadership statistics page.
What do the headline board figures hide?
Black directors held just 2.3% of FTSE 100 board positions at the March 2026 Parker Review — down from 2.4% — below their 3.9% share of the general population. The near-universal board coverage masks how thin representation remains for specific groups: much of the FTSE 100’s ethnic-minority board presence is accounted for by directors of Indian and other Asian heritage, while Black representation has flatlined and slipped.
The pipeline is thinner still. Ethnic minorities made up 11% of UK-based FTSE 100 senior management on average, stable year-on-year, and Black senior managers just 1.3% (Parker Review, March 2026). Senior management is the pool from which future directors are drawn, so a board figure that has raced ahead while the management figure has stalled points to a benchmark met by targeted board appointments rather than by a broadening of the leadership pipeline underneath.
Progress at the very largest private companies is patchier again: only 42% of the 50 largest private UK companies had met the 2027 target of at least one ethnic-minority main-board director, down from 48% the year before (Parker Review, March 2026) — a reminder that the listed-market gains are not automatically mirrored across the wider economy. Even where minority employees are in the building, perceptions of progression lag: 49% of ethnic-minority employees said their career progression had met or exceeded expectations, against 54% of White British employees (CIPD, 2024/25).
Frequently asked questions
What percentage of the UK workforce is from an ethnic-minority background?
At the 2021 Census, 19.3% of the working-age (16–64) population of England and Wales was from an ethnic-minority background — about 7.2 million people, roughly one in five. The remaining 80.7% (30.2 million) were from White ethnic groups. Older figures citing around 15% understate the current share.
What is the ethnicity employment gap in the UK?
In 2022, 77% of White people were in employment against 69% of all other ethnic groups combined — a broad-group employment gap of 8 percentage points. Separately, the unemployment rate in Jul–Sep 2025 was 8.8% for minority-ethnic people against 4.3% for White people, a gap of 4.5 points.
How many FTSE 100 companies have an ethnic-minority director?
98% of FTSE 100 companies had at least one ethnic-minority director by the March 2026 Parker Review, up from 52% in 2019. Ethnic-minority directors held 20% of all FTSE 100 directorships. However, Black directors held only 2.3% of FTSE 100 board positions, below their 3.9% population share.
Which ethnic group has the highest and lowest employment rate in the UK?
At the detailed group level in the Census 2021 analysis for England and Wales, the White Other group had the highest employment rate at 74.4% and the White Gypsy or Irish Traveller group the lowest at 37.4%. Among broad groups, the combined Pakistani/Bangladeshi group had the lowest rate at 61% in 2022.
Is ethnic diversity in the workplace improving?
On boards, yes and quickly: FTSE 100 coverage rose from 52% to 98% between 2019 and 2026, and FTSE 250 from 22% to 82%. On employment and unemployment, gaps have narrowed over the long run but persist — minority-ethnic unemployment (8.8%) remains more than double the White rate (4.3%), and senior-management representation (11%) has stalled.
Related guides
- Ethnicity Pay Gap Statistics UK: Gaps by Group, Trends & Mandatory Reporting
- Workplace Discrimination Statistics UK: Tribunal Claims, Prevalence & Protected Characteristics
- Women in Leadership Statistics UK
- Equality Act 2010: The Complete UK Guide
- Cultural Diversity in the Workplace: A Practical Guide
Sources & references
- ONS — Dataset A09: Labour market status by ethnic group (released 19 May 2026, Jul–Sep 2025 reference)
- ONS — Diversity in the labour market, England and Wales (Census 2021)
- GOV.UK Ethnicity facts and figures — Working-age population (Census 2021)
- GOV.UK Ethnicity facts and figures — Employment (2022, Annual Population Survey)
- GOV.UK Ethnicity facts and figures — Employment by occupation (2021)
- GOV.UK Ethnicity facts and figures — Economic inactivity (2022)
- Parker Review — Ethnic diversity of UK boards (March 2026 report)
- House of Commons Library — Unemployment by ethnic background (SN06385, 2025/26 update)
- CIPD — Race inclusion and career progression (2024/25)
Ethnic-minority workers are one in five of the working-age population but still face a doubled unemployment rate and a thin senior-management pipeline — equip your team to build genuinely inclusive recruitment and progression under the Equality Act 2010.
Explore the Equality, Diversity & Inclusion course →
Mark writes about equality, diversity and inclusion, UK workplace compliance and accredited online training for Equality, Diversity & Inclusion Training, part of Online CPD Academy.