
Apprenticeships in England look balanced by sex overall yet stay deeply segregated by subject, while representation of minority-ethnic and disabled learners has climbed steadily for the best part of a decade. This page pulls the diversity cut of the official apprenticeship data into one fully cited reference — the ethnicity, sex and learning-difficulty-or-disability breakdowns that usually sit buried across data catalogues. Every figure here comes from a named official or authoritative source — chiefly the Department for Education’s accredited Apprenticeships statistics, the House of Commons Library’s Apprenticeship statistics for England briefing, the GOV.UK Ethnicity facts and figures service and EngineeringUK’s analysis of the DfE data — with the data period stated alongside it. These statistics are for England only; the devolved nations publish separately, and we signpost those sources at the end.
Key facts and figures
- 353,500 apprenticeship starts in England in 2024/25, up 4.1% from 340,000 in 2023/24.
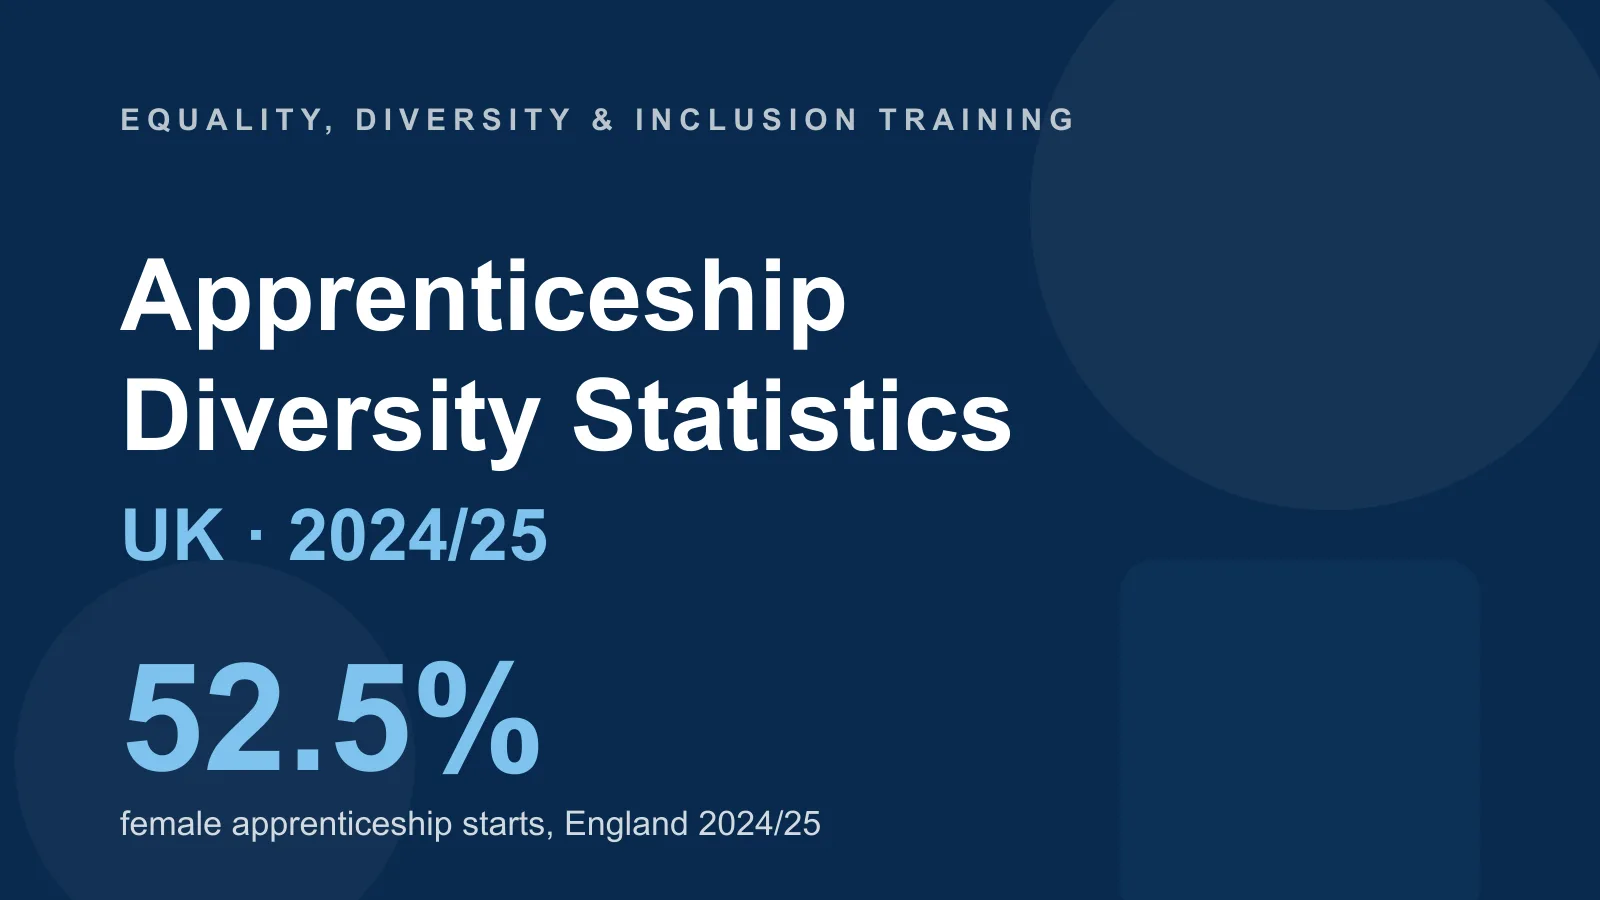
- 52.5% of starts were women in 2024/25 (men 47.5%) — a female share that has stayed between 50% and 55% since 2010/11.
- ~20% female — women’s share of engineering and technology-related apprenticeship starts in 2024/25, despite a 94% rise in female engineering starts since 2018/19.
- 19.2% minority-ethnic learners among 2024/25 starts, up from 12.8% in 2016/17; 80.8% of starters were White.
- 63,300 minority-ethnic learners started an apprenticeship in 2024/25, up from 42,230 in 2017/18.
- 16.1% of starts were by learners with a learning difficulty or disability (LLDD) in 2024/25, up from 11.2% in 2017/18.
- 56,900 LLDD starters in 2024/25, up from 42,200 in 2017/18.
- 40% of starts were higher-level (Level 4+) in 2024/25, up from 13% in 2017/18 — reshaping who reaches an apprenticeship.
These figures are the latest available as of July 2026. The Department for Education publishes on a fixed statutory cycle: in-year updates in January (Q1), March (Q2) and July (Q3), with the accredited full-year release each November. The 2024/25 full year was published on 27 November 2025 and updated on 29 January 2026; this page is refreshed against that calendar as new editions land, with the next full-year drop (2025/26) due in November 2026.
What percentage of UK apprentices are from ethnic minority backgrounds?
Minority-ethnic learners made up 19.2% of apprenticeship starts in England in 2024/25, up from 12.8% in 2016/17, according to the House of Commons Library’s Apprenticeship statistics for England (CBP 06113) and the DfE’s 2024/25 release. On that headline measure, 80.8% of starters were White. In absolute terms, 63,300 learners from a minority-ethnic background started an apprenticeship in 2024/25, up from 42,230 in 2017/18 — a rise of around half in seven years.
One caution for anyone quoting the ethnicity figure: the DfE reports it on two slightly different bases, and they should not be treated as contradictory. The headline minority-ethnic measure (also described as BAME) was 19.2% in 2024/25. A narrower measure — ethnic minorities excluding white minorities — was 18.0% of starts in 2024/25, up from 16.5% the previous year. Both are legitimate; they simply define the denominator differently. Pick one, label it, and stay consistent.
Growth has not been even across groups. Over the five years to 2024/25, Asian/Asian British apprentice starts grew fastest at +56.1%, ahead of mixed/multiple (+52.0%) and Black/African/Caribbean/Black British (+42.6%) (DfE, Apprenticeships 2024/25). The table below sets out the most recent single-year ethnic-group breakdown available from the GOV.UK Ethnicity facts and figures service, which lags the DfE headline by about one cycle.
| Ethnic group | Share of apprenticeship starts | Data period / note |
|---|---|---|
| White | 83.5% | 2023/24 (of 339,580 starts) |
| Asian | 7.4% | 2023/24 |
| Black | 4.5% | 2023/24 |
| Mixed | 3.6% | 2023/24 |
| Other | 1.0% | 2023/24 |
Representation is not the same as parity. On the GOV.UK Participation in apprenticeships measure, Asian people are the most under-represented group among apprentices — 6.9% of apprentices against 9.0% of the 16-and-over population (2023/24). Apprenticeship starts here are the entry point to the labour market; for the diversity profile of the workforce those learners go on to join, see our ethnicity pay gap statistics page.
How many apprentices are women, and why are apprenticeships still gender-segregated?
Women made up 52.5% of apprenticeship starts in England in 2024/25 (men 47.5%), according to the House of Commons Library briefing — a female share that has held between 50% and 55% every year since 2010/11. On the headline count, apprenticeships are close to balanced by sex. The problem is not the top-line figure; it is what sits underneath it.
Segregation by subject is stark. Female starts accounted for just about 20% of engineering and technology-related apprenticeship starts in 2024/25, according to EngineeringUK’s analysis of the DfE 2024/25 data. That is off a low base and improving — female engineering starts have risen 94% since 2018/19 — but a near-doubling from a small number still leaves women a minority of one in five in the sector. The mirror image holds in traditionally female-dominated subjects, so the overall 52.5% conceals two largely separate cohorts rather than a genuinely mixed one.
This subject clustering matters because a small number of areas dominate the whole programme. Over half of all 2024/25 starts fell into just two subject areas — Business, Administration & Law (31.8%) and Health, Public Services & Care (21.2%); adding Engineering & Manufacturing (14.1%) and Digital (9.7%) covers over three-quarters of starts (HoC Library / DfE 2024/25). Where women and men concentrate within that handful of subjects drives most of the segregation story. The pattern echoes the leadership pipeline covered on our women in leadership statistics page.
What proportion of apprentices have a learning difficulty or disability?
Learners with a learning difficulty or disability (LLDD) were 16.1% of apprenticeship starts in 2024/25, up from 11.2% in 2017/18, according to the House of Commons Library briefing and the DfE 2024/25 release. In headcount terms, the number of LLDD starters rose from 42,200 in 2017/18 to 56,900 in 2024/25 — an increase of around a third over seven years, faster than the growth in total starts over the same period.
“LLDD” is a self-declared, broad category in the DfE data, spanning learning difficulties, disabilities and health conditions, so it is not directly comparable with the Equality Act 2010 definition of disability used in workforce statistics. It is best read as a measure of the direction of travel — the share of apprentices who identify as having a learning difficulty or disability has risen every year in this window — rather than a precise disability-prevalence figure. For the workforce those apprentices go on to join, and the gap between disabled and non-disabled employment rates, see our disability employment gap statistics page. Rising representation at the apprenticeship entry point does not on its own close that later gap, which is why the duty to make reasonable adjustments matters as much for apprentices as for any other worker.
Is diversity improving in engineering and technology apprenticeships?
Yes, but from a very low base. Engineering and technology is the subject area where under-representation of both women and minority-ethnic learners is most acute, and it is also where the fastest recent gains have been recorded. Female starts in the area are up 94% since 2018/19 to reach about 20% of the total in 2024/25 (EngineeringUK analysis of DfE data). On ethnicity, 16% of engineering and technology-related apprenticeship starts were by people from a UK minority-ethnic background in 2023/24, up from 8% in 2018/19 — a doubling in five years, though still below the all-subject minority-ethnic share.
Because engineering and manufacturing accounts for 14.1% of all starts, shifts in its intake move the national diversity numbers materially. The direction is encouraging; the distance remaining is large. Employers running early-careers and social-value programmes tend to focus effort here precisely because the gap between the sector’s intake and the wider apprentice population is where targeted action shows up fastest in the data.
How is the shift to higher levels changing who reaches an apprenticeship?
Higher-level (Level 4 and above) apprenticeships rose from 13% of starts in 2017/18 to 40% in 2024/25, while intermediate (Level 2) starts fell from 43% to 19% over the same period (HoC Library / DfE 2024/25). This is one of the most consequential shifts in the programme for diversity, because it changes the entry point itself: the growth has been concentrated in higher-level, often older-learner routes rather than the entry-level starts that once served school leavers.
The age profile has moved with it. Over half — 51.3% — of 2024/25 starts were by apprentices aged 25 or older, and only 21.2% were under 19 (HoC Library / DfE 2024/25). An apprenticeship is now, for the majority of starters, a mid-career or upskilling route rather than a first step out of school. Who benefits from that shift — and whether it widens or narrows access for under-represented groups — is an open question the annual data will keep answering. It is one reason the headline “52.5% female” and “19.2% minority-ethnic” figures are worth reading alongside the level and age breakdowns rather than on their own.
How often is apprenticeship diversity data updated?
The Department for Education updates the apprenticeship figures on a guaranteed quarterly-plus-annual cycle. In-year updates are published in January (Q1), March (Q2) and July (Q3), with the accredited full-year release each November. The 2024/25 full year was published on 27 November 2025 and updated on 29 January 2026. The 2025/26 in-year data (covering August 2025 to January 2026) was published on 26 March 2026, with the next update due in July 2026.
Because the cadence is statutory and predictable, this page can be refreshed against a known calendar — most usefully at the November 2026 full-year drop, when the accredited 2025/26 diversity breakdowns land. The GOV.UK Ethnicity facts and figures service updates roughly yearly and typically lags the DfE headline by about one cycle, which is why some ethnic-group detail here is dated 2023/24 while the headline shares are 2024/25.
All figures on this page are for England. The devolved nations publish their own apprenticeship data: Skills Development Scotland, StatsWales and ApprenticeshipsNI each report separately, and their definitions differ, so UK-wide totals should not be assembled by simply adding the four together.
Frequently asked questions
What percentage of UK apprentices are from ethnic minority backgrounds?
Minority-ethnic learners made up 19.2% of apprenticeship starts in England in 2024/25, up from 12.8% in 2016/17, with 80.8% of starters being White (House of Commons Library / DfE 2024/25). On the narrower “ethnic minorities excluding white minorities” measure the figure was 18.0%. In headcount, 63,300 minority-ethnic learners started an apprenticeship in 2024/25.
How many apprentices are women, and why are apprenticeships still gender-segregated?
Women were 52.5% of apprenticeship starts in England in 2024/25 (men 47.5%), a share that has stayed between 50% and 55% since 2010/11. Apprenticeships look balanced overall but remain segregated by subject: women were only about 20% of engineering and technology-related starts in 2024/25, even after a 94% rise in female engineering starts since 2018/19.
What proportion of apprentices have a learning difficulty or disability?
16.1% of apprenticeship starts in 2024/25 were by learners with a self-declared learning difficulty or disability (LLDD), up from 11.2% in 2017/18 — 56,900 starters, up from 42,200. LLDD is a broad, self-declared category and is not directly comparable with the Equality Act 2010 definition of disability.
How often is apprenticeship diversity data updated?
The Department for Education publishes in-year updates in January, March and July, with an accredited full-year release each November. The 2024/25 full year was published on 27 November 2025 (updated 29 January 2026), and the next full-year release, for 2025/26, is due in November 2026.
Are apprenticeships in England getting more diverse?
On representation, yes: the minority-ethnic share of starts rose from 12.8% (2016/17) to 19.2% (2024/25), and the LLDD share from 11.2% (2017/18) to 16.1% (2024/25). Sex is close to balanced overall at 52.5% female. The persistent challenge is subject segregation — most visibly women’s ~20% share of engineering and technology starts — rather than headline representation.
Related guides
- Ethnicity Pay Gap Statistics UK
- Disability Employment Gap Statistics UK: Rates, Pay Gap & Trends
- Women in Leadership Statistics UK
- Neurodiversity Statistics UK: Autism, ADHD & Dyslexia Prevalence and Employment
- Why Diversity Matters in the Workplace: A UK Guide
Sources & references
- DfE — Apprenticeships, Academic year 2024/25 (Explore Education Statistics)
- DfE — Apprenticeships, Academic year 2025/26 (in-year)
- House of Commons Library — Apprenticeship statistics for England (CBP 06113)
- GOV.UK Ethnicity facts and figures — Apprenticeship starts
- GOV.UK Ethnicity facts and figures — Participation in apprenticeships
- EngineeringUK — Analysis of the apprenticeships 2024/25 data from DfE
- DfE — Apprenticeships: subjects and levels, learner demographics (data set)
A diverse intake only pays off when the workplace people join is inclusive too — train your team on the Equality Act 2010, fair recruitment and inclusive practice.
Explore the Equality, Diversity & Inclusion course →
Mark writes about equality, diversity and inclusion, UK workplace compliance and accredited online training for Equality, Diversity & Inclusion Training, part of Online CPD Academy.